Debugging Direct3D12 Apps with RenderDoc
Debugging even simple shaders to see if they are working correctly is difficult. At first I tried to debug using PIX, but although I could see the contents of the constant buffer, I could not see the VertexShader vertex data, I wondered if my settings were bad, but when I asked Dr. ChatGPT, his answer was to use RenderDoc when in trouble, so I decided to use RenderDoc with half a doubt.
RenderDoc worked easily. I could see the vertex data of VertexShader without any particular settings, and the step execution of shaders worked without any problem.
The debugging method for VertexShader is as follows.
- Specify the app you want to debug in the ExecutablePath.
- Execute the app with the Launch button.
- Caputure Frame(s) Immediately Capture one frame by clicking the Capture button
- Double-click on the captured image
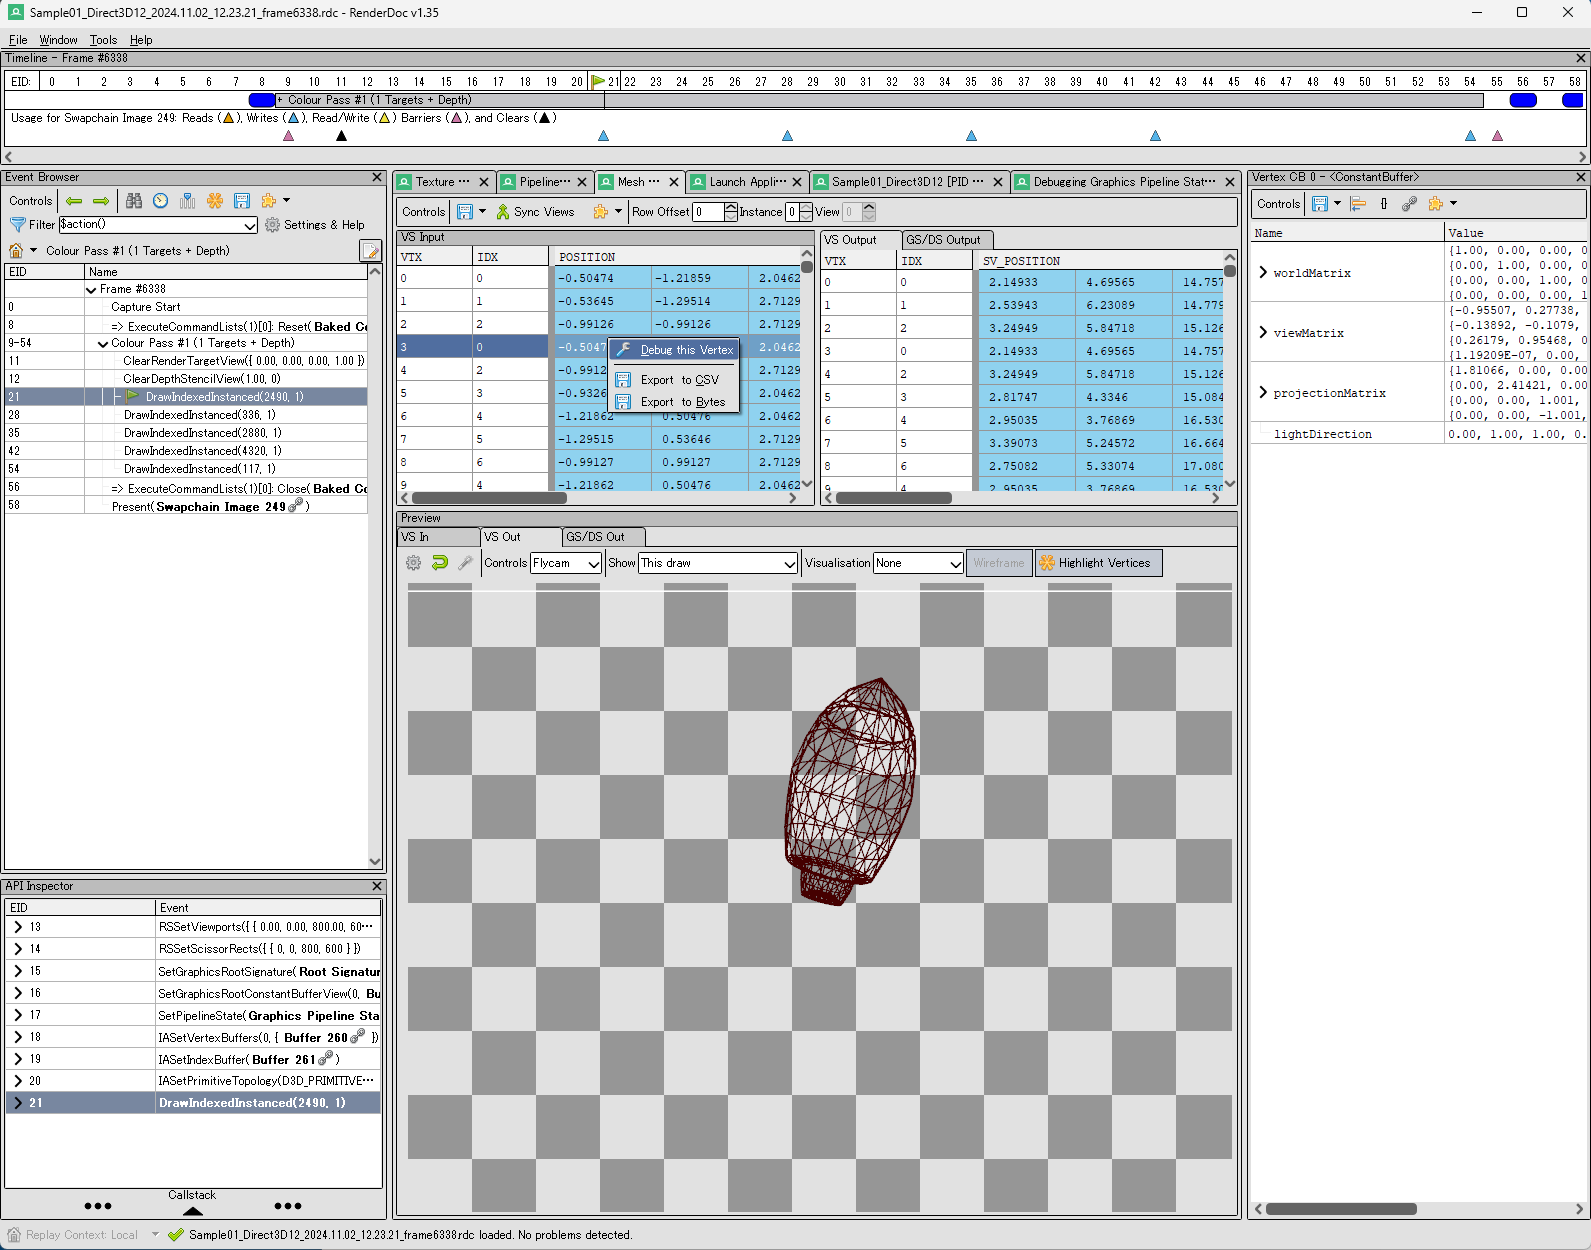
- From the EventBrowser on the left, select the drawing command, such as DrawIndexedInstanced, that you want to debug
- View buffer contents in the Pipeline State tab
- View VSInput and VSOutput vertex data in the Mesh Viewer tab
- Select a specific vertex in the Mesh Viewer tab, right-click, and select Debug this vertex.
- The shader assembler will be displayed, press F10 to step through andShift+F10to return
It is easy to use and well done.